New Car Prices in September 2026: Buyers Paid $50,562 on Average
The average new vehicle sold for $50,562 in September 2026, $52 short of the record, per Kelley Blue Book. Prices by segment, incentives and a payment example.
Key Takeaways
- The average new vehicle sold for $50,562 in September 2026, up 0.9% from August and 0.7% from a year earlier, according to Kelley Blue Book.
- Incentives averaged $3,359, or 6.6% of the transaction price, down from 7.3% of the price in September 2025, according to Kelley Blue Book.
- Financing $45,562 at the Fed’s August 2026 bank rate of 7.54% for 60 months works out to about $914 a month and $9,268 in total interest.
In this article
New-car buyers paid an average of $50,562 in September 2026, according to Kelley Blue Book, a Cox Automotive brand. That was up 0.9% from August’s $50,089 and only $52 below the all-time high of $50,614 set in December 2025.
The yearly gain was small, though: prices rose 0.7% from September 2025. Kelley Blue Book said that is well below the 2% to 4% increase that is typical for September, mostly because more buyers chose cheaper vehicles.
What buyers paid in September, by segment
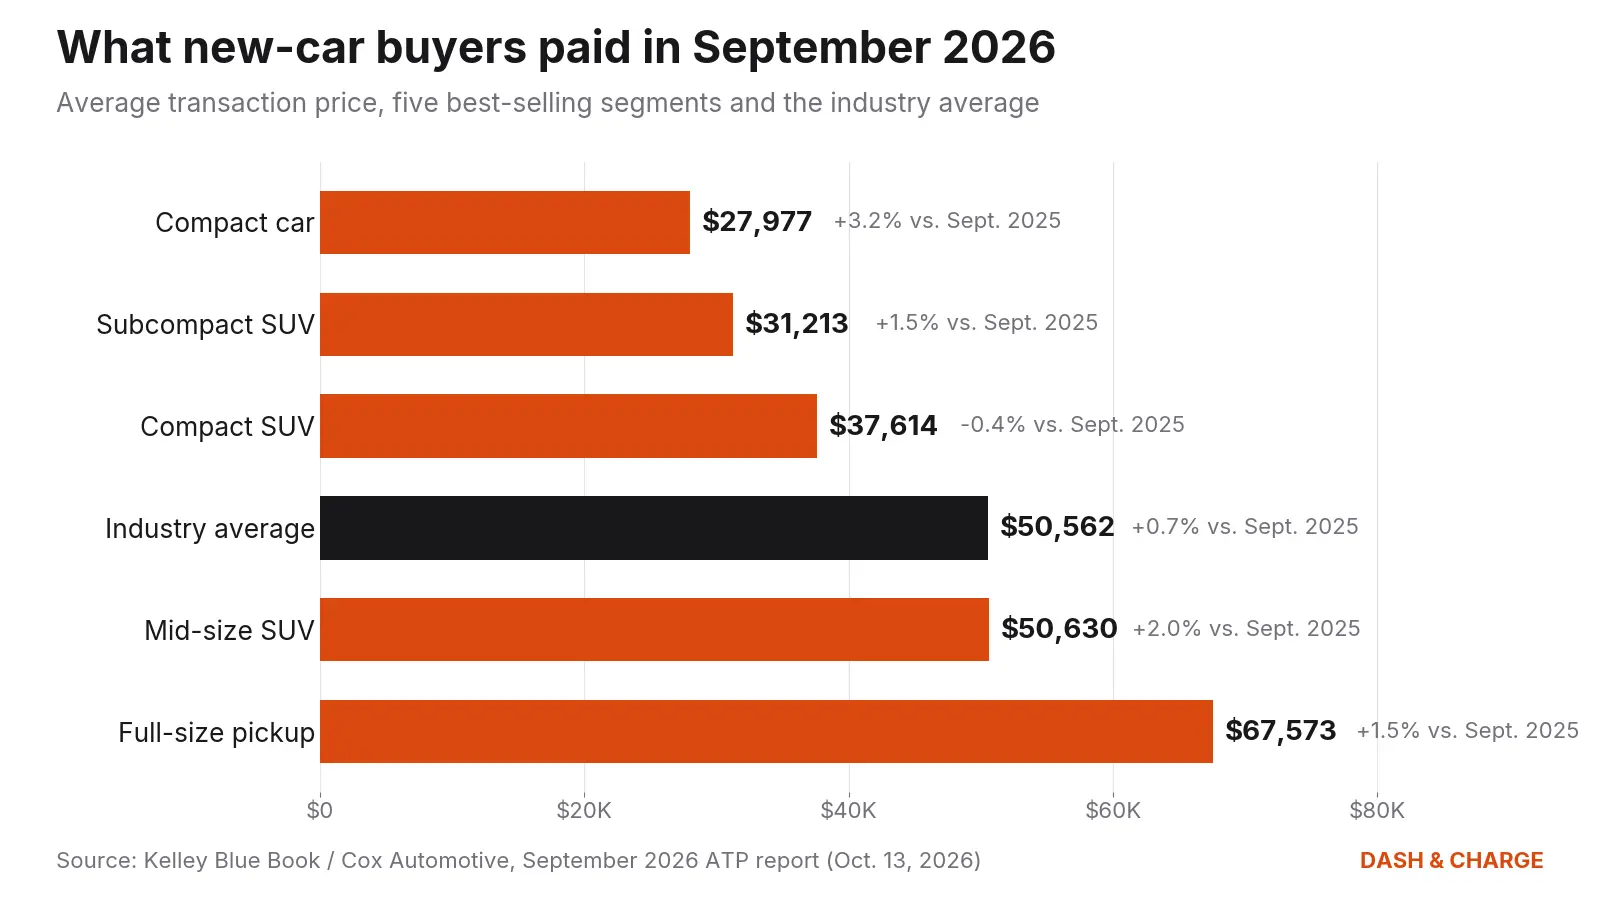
The average transaction price (ATP) is the price buyers actually paid, as opposed to the sticker price. The five best-selling segments made up roughly 855,000 sales in September, nearly two-thirds of the month’s total, according to Kelley Blue Book.
| Segment | Average transaction price, Sept. 2026 | Change vs. Sept. 2025 |
|---|---|---|
| Compact car | $27,977 | +3.2% |
| Subcompact SUV | $31,213 | +1.5% |
| Compact SUV | $37,614 | −0.4% |
| Mid-size SUV | $50,630 | +2.0% |
| Full-size pickup | $67,573 | +1.5% |
| Industry average | $50,562 | +0.7% |
| Electric vehicle (EV) | $55,879 | −3% |
Four of those five segments rose faster than the industry average. That sounds like a contradiction, but it is about mix: when more people buy compact cars and small SUVs, the overall average is pulled down even as each segment gets pricier.
“Consumers don’t buy the industry average. They buy a vehicle, and prices for many of the vehicles they’re shopping are continuing to move higher,” said Erin Keating, executive analyst at Cox Automotive. “What’s keeping the overall average transaction price increase relatively modest is mix. Affordability pressures are pushing more buyers toward lower-priced vehicles and segments, which tempers the industrywide number even as prices for individual vehicles rise.”
Kelley Blue Book also pointed to the slow arrival of next-model-year vehicles, which it said is well behind historic norms. New model-year inventory is often priced higher.
Discounts are smaller than a year ago
Incentive spending averaged 6.6% of the transaction price in September, up slightly from 6.5% in August but below 7.3% in September 2025. In dollars, the average incentive was $3,359, up 2.6% from August but down 8.8% from a year earlier.
The average sticker price, or MSRP (manufacturer’s suggested retail price), was $52,342 in September, up from $51,821 in August and 0.8% higher than a year earlier. Subtract the average transaction price and the typical buyer paid about $1,780 below MSRP ($52,342 − $50,562), or roughly 3.4% off. For how those numbers relate to the dealer’s cost, see MSRP vs. invoice vs. market adjustment.
EVs are the exception on discounts. EV incentives were 11% of the transaction price in September, the lowest point of 2026 but still well above the industry average. A year earlier, they were 14.2%.
The average EV sold for $55,879 in September, up from a downwardly revised $54,574 in August but 3% lower than a year earlier, which Kelley Blue Book attributed to a mix of more affordable EV models. It put the EV price premium over what it calls ICE+ models at 11% in September; that gap has stayed near 11% throughout 2026, down from an average of close to 18% in 2025.
What government price data shows
The Bureau of Labor Statistics tracks vehicle prices in the Consumer Price Index (CPI), the government’s main inflation gauge. Its September data also shows modest new-vehicle price increases, while used cars and trucks cost slightly less than a year earlier.
| CPI index (BLS) | Change, Aug. to Sept. 2026 (seasonally adjusted) | Change, Sept. 2025 to Sept. 2026 (not seasonally adjusted) |
|---|---|---|
| New vehicles | +0.2% | +0.6% |
| New cars | +0.4% | +1.5% |
| New trucks | +0.2% | +0.5% |
| Used cars and trucks | +0.7% | −1.5% |
| All items (overall inflation) | +0.6% | +3.7% |
New-vehicle prices rose far more slowly than overall inflation, which ran at 3.7% over the 12 months to September. Gasoline, up 9.1% in September alone, accounted for more than half of that month’s overall increase, according to the BLS. Used cars and trucks rose 0.7% in September alone but were still 1.5% cheaper than a year earlier.
What it means for you
The price is only half of the cost. The other half is the loan. Commercial banks charged an average of 7.54% on 60-month new-car loans and 7.17% on 72-month loans in August 2026, according to the Federal Reserve’s G.19 report. The Fed collects these rates once a quarter.
Example: financing the average new vehicle. Take the September average price of $50,562 and subtract a $5,000 down payment (an illustration; taxes and fees are left out). You finance $45,562.
- 60 months at 7.54%: about $914 a month. Over five years you pay about $54,830, so interest costs $9,268.
- 72 months at 7.17%: about $781 a month. Over six years you pay about $56,197, so interest costs $10,635.
The longer loan cuts the payment by about $133 a month but adds about $1,367 in interest, even with a lower rate. Our guide to car loan length walks through that trade-off.
Example: the compact SUV instead. At the segment’s $37,614 average price with the same $5,000 down, you finance $32,614. At 7.54% for 60 months, the payment is about $654 a month, roughly $260 less than the average-vehicle example.
For comparison, Cox Automotive’s September Vehicle Affordability Index, built with Moody’s Analytics, put the typical new-vehicle payment at $776, up 0.8% from August and the highest since December 2023. That index uses Cox’s estimate of the average rate paid by consumers, 9.45%, calculated for a 72-month fixed-rate loan, which is well above the Fed’s bank average. It took 35.72 weeks of median income to buy the average new vehicle in September, up from 35.5 weeks in August.
Your own rate depends on your credit, the lender and the loan length; how auto loan rates are set explains the factors.
What to watch next
- Nov. 10, 2026: the BLS releases the October CPI, with new and used vehicle price changes for the month.
- Kelley Blue Book’s October report: the next transaction price update from Cox Automotive. Kelley Blue Book says prices typically trend upward in the second half of the year as more next-model-year inventory arrives; see the best time to buy a car for how timing affects deals.
- Nov. 16, 2026: Cox Automotive’s next Vehicle Affordability Index update, which will show whether the typical payment moved past $776.
Sources
- Cox Automotive — Kelley Blue Book Report: Average New-Vehicle Transaction Prices Flirt with All-Time High, Despite Trend Toward More Affordable Product (Oct. 13, 2026)
- Cox Automotive — New-Vehicle Affordability Declines in September as Prices, Payments Rise (Oct. 19, 2026)
- Bureau of Labor Statistics — Consumer Price Index Summary, September 2026
- Bureau of Labor Statistics — CPI Table 2, by detailed expenditure category, September 2026
- Bureau of Labor Statistics — Schedule of releases for the Consumer Price Index
- Federal Reserve — G.19 Consumer Credit (released Oct. 7, 2026)
